NetCom Tool
Freilich Lab
NetCom - A Tool For Functional Interpretation Of Metagenomic Data

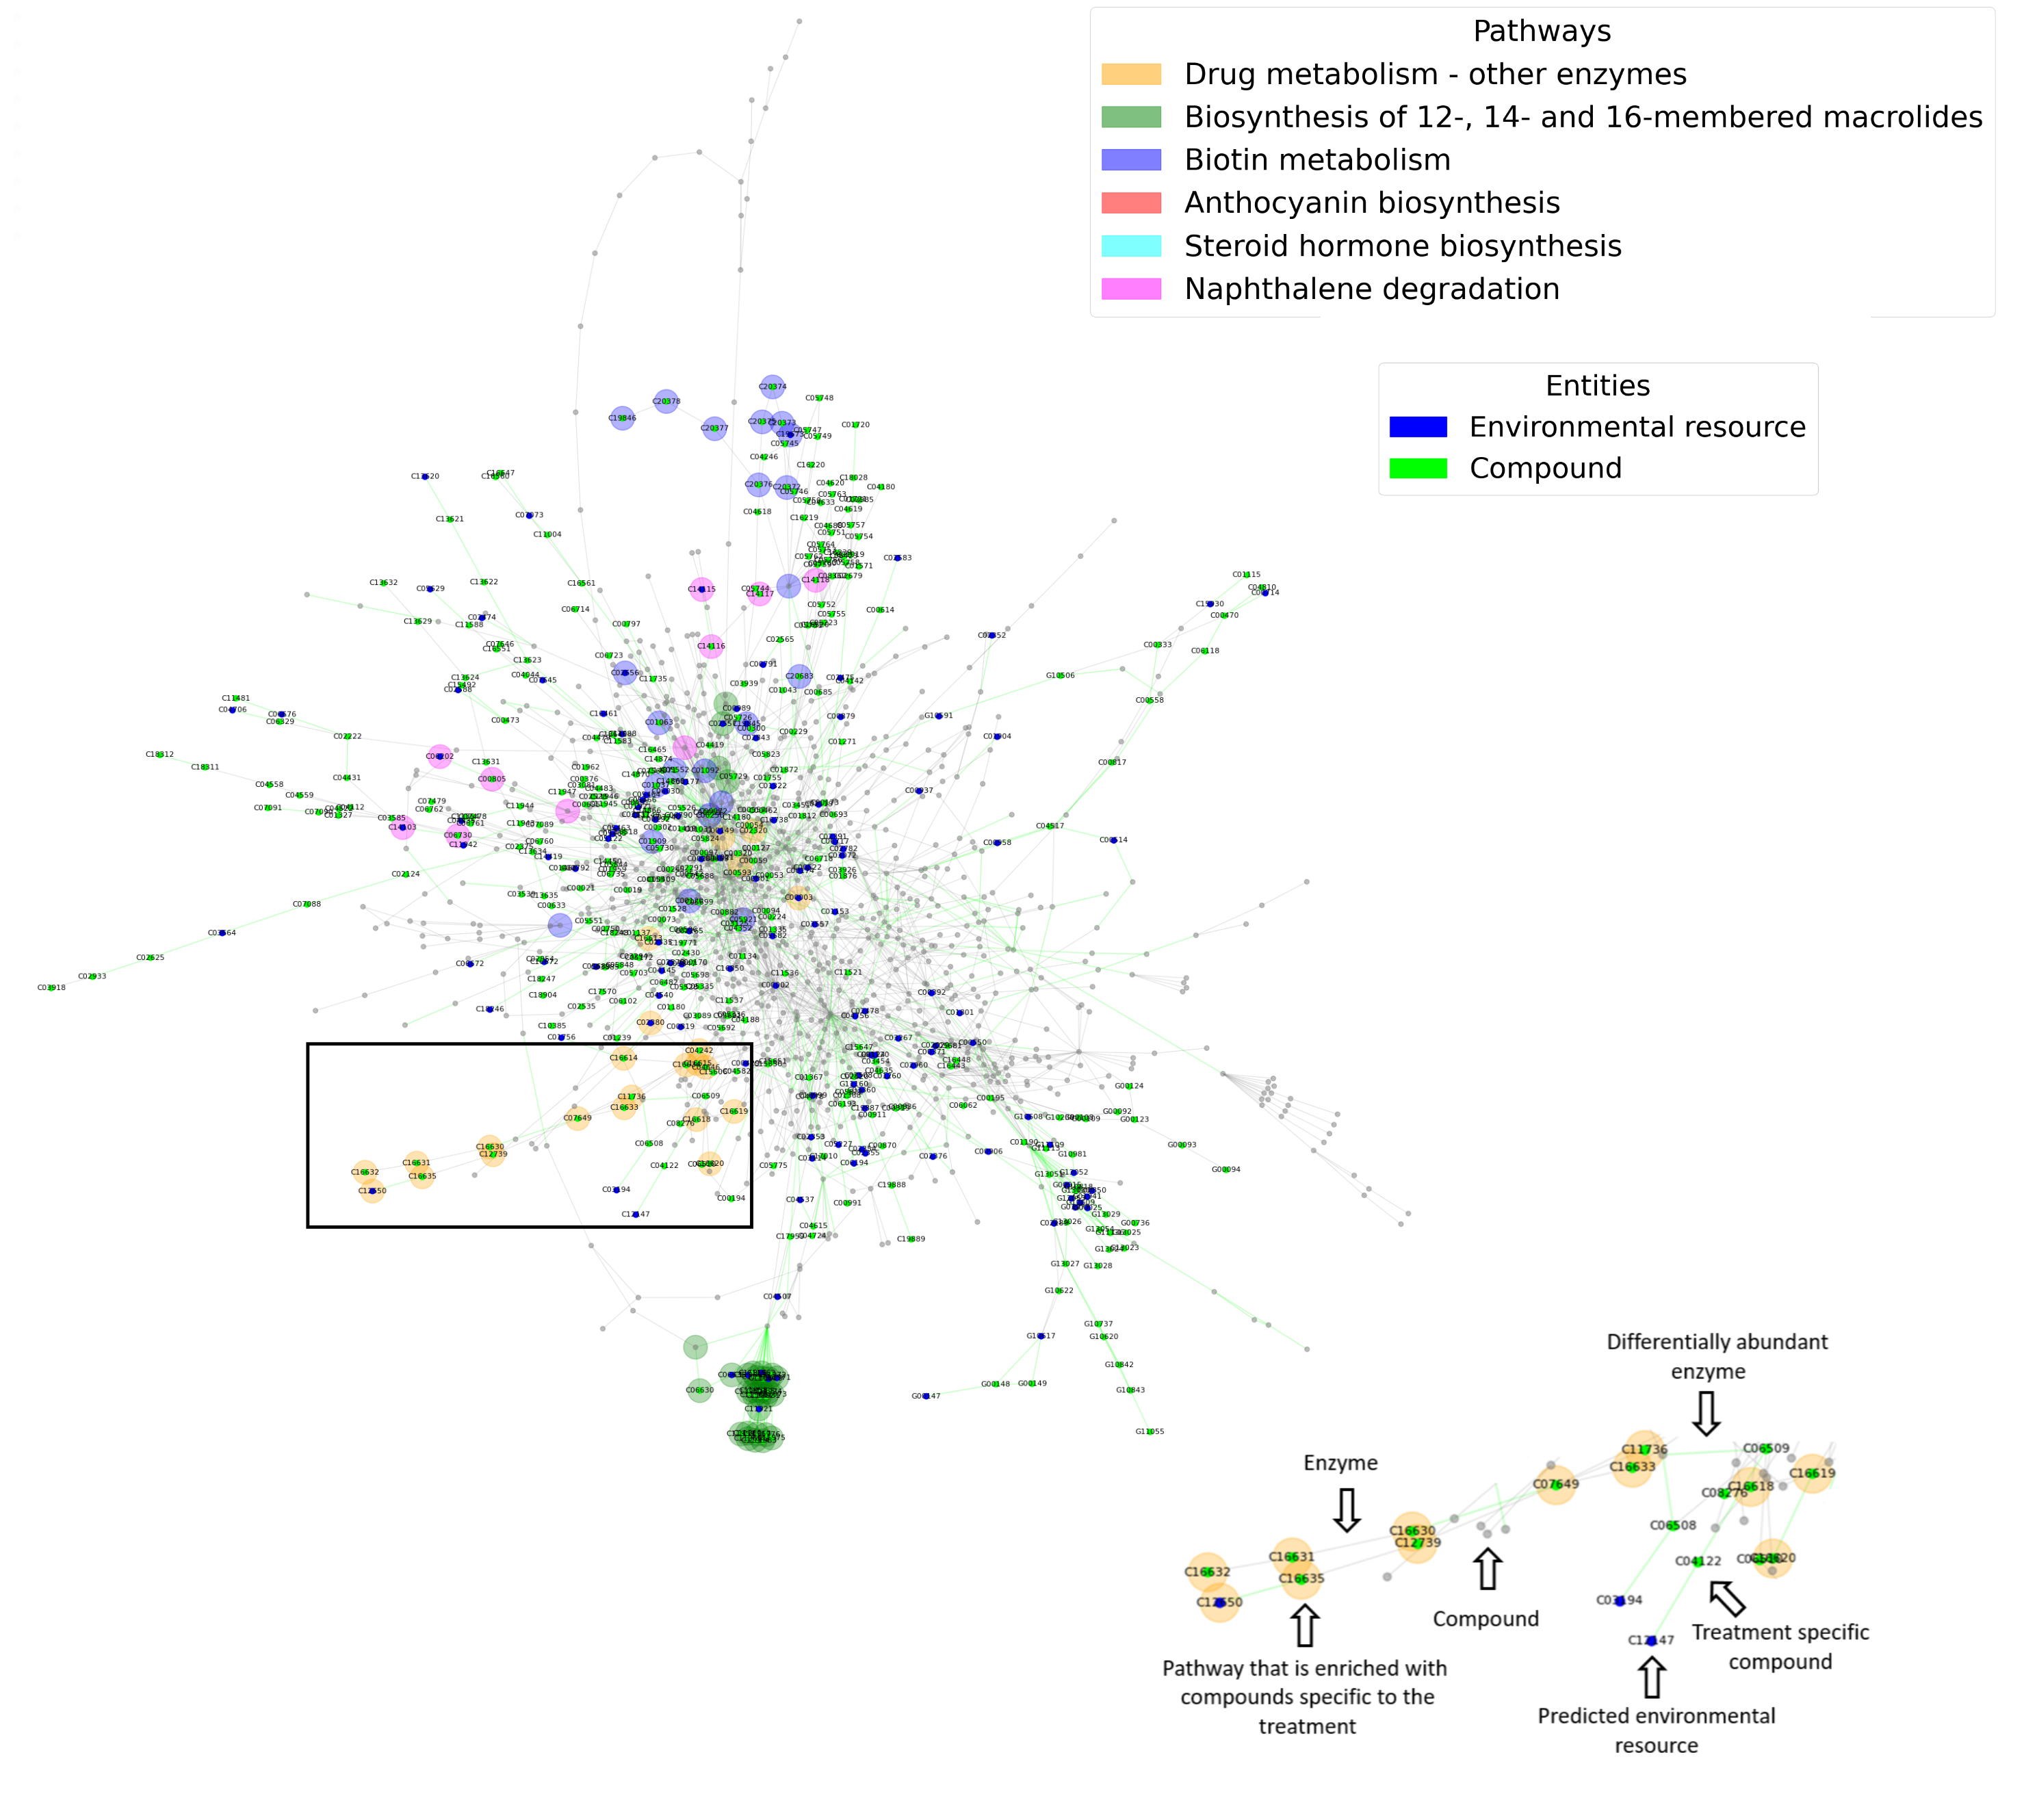
NetCom is a tool for predicting metabolic activities in microbial communities based on network-based interpretation of assembled and annotated metagenomics data. The algorithm takes as input an EdgeR output file that provides information on the differential abundance of enzymatic reactions in two different treatments. Enzymes are classified as associated with Treatment_1, Treatment_2 or not associated. The algorithm generates as output:
- Lists of differentially abundant enzymes and their pathway association.
- Prediction of environmental resources that are unique to each treatment and their pathway association.
- Prediction of environmental compounds that are produced by the microbial community and pathway association of compounds that are treatment-specific.
- Network visualization of enzymes, environmental resources and produced compounds that are treatment specific (2 & 3D).

Data in the example file was taken from metagenomics sequencing of the root environment of wheat (Treatment 1 – 'root') and the more distant soil not under direct effect of the plant (Treatment 2 – 'soil').
Data was taken from Ofek-Lalzar et al, Nature Communication 2014
Instructions
Simulator
×
![]()